
Why Vitest?
When I started working in product UI development four years ago, the first things I had to get familiar with were the how and why of testing. In my time in the advertising world it was hard to make the case that a client should invest in the time it takes to develop and maintain tests for their websites. While we were often using components and patterns that might have benefited from it, anywhere they could cut down on development time often beat out any benefit you would suggest testing had.
Fast forward to today where, for the team and I, writing unit and end-to-end tests are pretty regular and we talk about things like code coverage and mocking techniques. For front-end projects, I've worked with the likes of Mocha, Jest, Cypress, and Vitest—even doing some conversions from one testing framework to another. Each framework has its benefits and—in my opinion so far—Vitest rules when it comes to writing and executing unit tests for framework JavaScript work. Vitest lives up to the Vite name in being extremely fast in most areas where I think it counts: installing, running tests, and watching for changes. It stands on the shoulders of a lot of tools I was already familiar with (Jest, Vite, Chai, etc...) but somehow using all of those tools in Vitest’s abstracted way seems a lot easier to work with than it would be to install and configure them all separately.
Where Vitest has been my go-to for unit tests, writings E2E (end-to-end) or component tests were better done in tools like Cypress and Playwright. That was up until recently when Vitest 4 came out and made its Browser Mode stable. Now, instead of having projects where you would wind up installing multiple testing suites covering their respective areas, the promise of Vitest is that you can simplify dependencies and use different modes in Vitest to achieve the same thing.
Vitest 4 also introduced a new feature that uses the browser mode to take screenshots and diff them in your tests so you can perform visual regression testing. This can be done using a headless browser or using Vitest’s browser UI to see your results in a browser, like Chromium.
Testing Shadow DOM-Based Web Components
Outside of my day job I spend time learning and maintaining a web component, called Admin Bar Component. Admin Bar Component is built on Lit and it is built using a closed Shadow DOM, so when it’s put on any given website you avoid collision with the CSS styles on the page. Technically Admin Bar Component is also made up of several custom elements under one package and they are glued together with a bunch of CSS Custom Properties that can be used for theming and customization.
If you want to test a project like this, you are likely looking to create a series of component tests in the browser that let you verify that props and slots display the correct markup and you’ll want to make sure user actions and events work consistently.
As I mentioned in my previous blog post about Admin Bar Component, I’m working towards a 2.0 version and my goal is to make improvements around the project wherever I can. In the 1.x version I did some very limited component testing with Cypress, but there was a ton of room for improvement for my part there. When I heard about the visual regression testing feature in Vitest 4, I was curious enough to give it a try. I got it up and running and in a few days I had created new component tests that covered my previous Cypress tests and added coverage for the rest of the current set of pre-2.0 features. I used Playwright as my testing provider and used its tools to verify slots and props. I also used visual regression testing to handle testing CSS classes and style changes.
While it’s still a work in progress you can take a look at my work in the current 2.0 branch of Admin Bar Component. The rest of this blog post includes my notes from this process and it can be useful for folks who would like to set this sort of testing environment up for themselves.
Testing Setup
Vitest—just like Vite—handles dependencies a-la-carte based on what you need for your tests. The first one, if it’s not obvious, is that you’ll need Vite installed. If you are new to setting up Vite you may start with one of their project templates based on a framework and if you're using TypeScript in your project.
I already had Vite set up so I added three NPM dependencies to my package.json file:
- @vitest/browser-playwright – I picked Playwright as my testing provider, so this was required by Vitest. If you prefer, you could use WebdriverIO as an alternative.
- vitest
- vitest-browser-lit – This package is specific to Lit and it makes it easier to set up testing fixtures.
For good measure, I also made sure Vite and my other NPM dependencies were all up to date.
Configuration
I already had a Vite config file in place, and Vitest gives you the option to either create a separate Vitest config file or you can add a test property to your Vite config object and place all of your Vitest config options in there. I went the latter route and added the following to my existing config file:
import { defineConfig } from 'vite'
import { playwright } from '@vitest/browser-playwright'

export default defineConfig(({ mode }) => ({
  // ... project config options, like `server`, `build`, or `resolve` ...
  test: {
    browser: {
      // Enable browser mode for all tests.
      enabled: true,

      // Set defaults for all visual regression tests.
      // These can be overridden in the tests as needed.
      expect: {
        toMatchScreenshot: {
          comparatorName: 'pixelmatch',
          comparatorOptions: {
            threshold: 0.2,
            allowedMismatchedPixelRatio: 0.2,
          },
        },
      },

      // Use the headless browser by default.
      headless: true,

      // Set the browsers to run all the tests in.
      instances: [{ browser: 'chromium' }],

      // Select the provider to run the tests in.
      provider: playwright(),

      // Set a default viewport size.
      // This can also be changed as needed in the tests.
      viewport: { width: 500, height: 100 },
    },

    env: {
      // Enables screenshots for visual regression tests.
      ENABLE_SCREENSHOTS: !loadEnv(mode, process.cwd(), '').VITE_DISABLE_SCREENSHOTS,
    },

    // Point to a setup file that can be used to set up mocks or
    // actions before each tests, or as cleanup after tests.
    setupFiles: ['./vitest/setup-file.ts'],
  },
}))
Notice that this returns a function instead of an object. This is so we can use loadEnv.
Most of the lines above can be explained by their comments, but here are a couple of other things to note:
- Setting
test.browser.enabledtotruemeans all test will run in Browser mode. If you wanted to do some unit tests you might be better off breaking this config up into a common config option for things likebuildandresolve, then create separate projects in aprojectsarray. There you could have one project with testing config that only applies to your unit tests and another that looks like the config above for the browser tests. The unit test one could specify an environment, likejsdom, and leave out the overhead of the browser tests. - Started with the
chromiumbrowser here, but I intend to set up tests for all of the other browser engines I’d like to run tests on. FYI, when I first ran Vitest, I was prompted to install Chromium before the tests could run. - I picked Playwright here because I was more familiar with it. Vitest abstracts out a lot of the Playwright context stuff, but some of the locators have similar names and it might be easier to pick up than WebdriverIO. But you do what works best for you.
test.env.ENABLE_SCREENSHOTSis a workaround that I’ll explain in a bit.
The file linked in the setupFiles option is specific to only the browser tests. I created a vitest directory to keep all of my testing helpers and anything else that are used only for Vitest testing purposes.
import 'vitest-browser-lit'
import { defineAdminBarElements } from '../lib/main'
import { beforeAll, beforeEach } from 'vitest'
import '../public/admin-bar.css'

beforeAll(() => {
  // Defines all Admin Bar custom elements once before all tests run.
  defineAdminBarElements(['button', 'checkbox', 'text'])
})

beforeEach(async () => {
  // Set browser to light mode so all screenshots are consistent.
  document.body.style.colorScheme = 'light'
})
The beforeAll method runs once and beforeEach runs before every test.
Finally, I added the three scripts to my package.json file, test, test:ui and test:run:
{
  "scripts": {
    "dev": "vite",
    "build": "tsc && vite build",
    "deploy": "npm run test:run && npm run build && npm publish",
    "preview": "vite preview",
    "test": "vitest --test-timeout=1000",
    "test:ui": "VITE_DISABLE_SCREENSHOTS=true vitest --browser.headless=false --test-timeout=1000",
    "test:run": "vitest run"
  }
  ...
}- test – Runs all tests then starts watching for file changes—re-running any test that was affected by a file change.
- test:ui – Does the same as
testbut also opens up Vitest UI in the browser so you can navigate tests in their GUI and see the test output in the browser. - test:run – Runs all tests and returns the summary if all tests pass or displays errors for failed tests. This is the kind of script you might include in a CI/CD pipeline.
In a couple of tests I knocked the --test-timeout down to 1000ms (from the 15000ms default) because when a browser test gets stuck on something like a missing locator, then it waits until the test times out to report errors. Setting --test-timeout=1000 means the tests will fail after 1 second and that is a lot better when you are in the process of writings tests and you want to see the outcome right away. This value might need to be bumped up over time.
Regarding the test:ui script, I think that requires a little unpacking. I realized that when you jump between the headless browser and running Vitest UI there would be discrepancies in the screenshots taken during visual regression tests, resulting in tests that failed due to some minor rendering differences. To get around this, I have turned on the headless browser by default so that in the tests where I want screenshots diffed, they are all taken in the same headless browser environment.
When running Vitest UI in the browser, I use the VITE_DISABLE_SCREENSHOTS ENV variable to set ENABLE_SCREENSHOTS as an ENV variable I can use in my tests. This is why I am setting test.env.ENABLE_SCREENSHOTS in the vitest.config.js file:
import { defineConfig, loadEnv } from 'vite'

export default defineConfig(({ mode }) => ({
  // ...
  test: {
    // ...

    env: {
      // Enables screenshots for visual regression tests.
      ENABLE_SCREENSHOTS: !loadEnv(mode, process.cwd(), '').VITE_DISABLE_SCREENSHOTS,
    },

    // ...
  },
}))
ENABLE_SCREENSHOTS is set to the opposite of VITE_DISABLE_SCREENSHOTS and it defaults to true.
In any test where I need a screenshot taken, I can now wrap the line that takes the screenshot in a quick check:
if (import.meta.env.ENABLE_SCREENSHOTS) {
    // ...
}
So when I run my test:ui script, Vitest UI opens up a Chromium browser window and all of the tests that would have taken a screenshot will pass because there was no failed assertion made. It may seem a little bit misleading, but in a situation where I want to view my tests in the browser I can still see the HTML rendered and I'm able to use Developer Tools to help debug potential issues.
Writing Tests
The actual tests you write for the browser aren’t all that different from the ones you would write for a unit test in Vitest (which is similar to a ton of other testing frameworks).
import { render } from 'vitest-browser-lit'
import { describe, expect, test } from 'vitest'
import { html } from 'lit'
import { fpoImageSrc } from '../../vitest/helpers.ts'

describe('Greeting', () => {
  test('Displays greeting avatar and alt text', async () => {
    const screen = render(html`<admin-bar show-greeting avatar-alt="test" avatar-src="${fpoImageSrc}"></admin-bar>`)

    await expect.element(screen.getByAltText('test')).toBeVisible()
  })
})
Here the render function is used to render a Lit html template. This renders the HTML and gives you a variable you can reference to find things in the rendered markup.
The assertion line has a couple things to note. Instead of using expect() there is now an expect.element() method and this lets you use assertions like .toBeVisible(). I found that you can have tests that include both expect methods, so you can use whichever one works for the thing you are testing against, but in browser tests I wound up using expect.element() most of the time.
The expect.element() method is looking for a locator so you can use one of the ones that is returned from the render method. In the test above I need to find an image that is rendered in the shadow DOM of that <admin-bar> element, so I can do that by looking for its alt text value.
Visual Regression Testing
Writing visual tests work in a similar way, except you jump back to expect() and use the assertion, .toMatchScreenshot(). When you call .toMatchScreenshot(), Vitest will look for an existing screenshot and if it finds one it will check to see if it matches. If it doesn’t find one you'll get an error and if you are using the CLI, you can type the letter u to re-run the test and generate a new image.
It looks like this:
test('Displays button as greeting button when attribute is set', async () => {
  const screen = render(
    html`<admin-bar>
      <admin-bar-button greeting-button>Button Label</admin-bar-button>
    </admin-bar>`
  )

  await screen.getByText('Button Label').hover()

  if (import.meta.env.ENABLE_SCREENSHOTS) {
    await expect(screen.baseElement.querySelector('admin-bar')).toMatchScreenshot('admin-bar-button-greeting-button')
  }
})
So again, we have the render() method to render out the HTML for this test. On the next line there is a user event where because I wanted to get this button into the state where it shows what it looks like on hover. Finally, the expect().toMatchScreenshot() line is what diffs the screenshot for this test. The first argument in toMatchScreenshot() lets you set part of the filename for the screenshot. This makes it easier to go back into your file system and look for the screenshot for the test.
If you read the Vitest docs there is a recommendation that you use a locator, like page.getByText('Some Text'), to make sure you are taking a screenshot of only the element you are testing. In my case I typically went one element up to the wrapping <admin-bar> element because it’s easier to see the things I wanted to test in screenshots. To do this, I used screen.baseElement, which is a generic <div> around the HTML you provide in the render() method. So my screenshots usually look something like this:

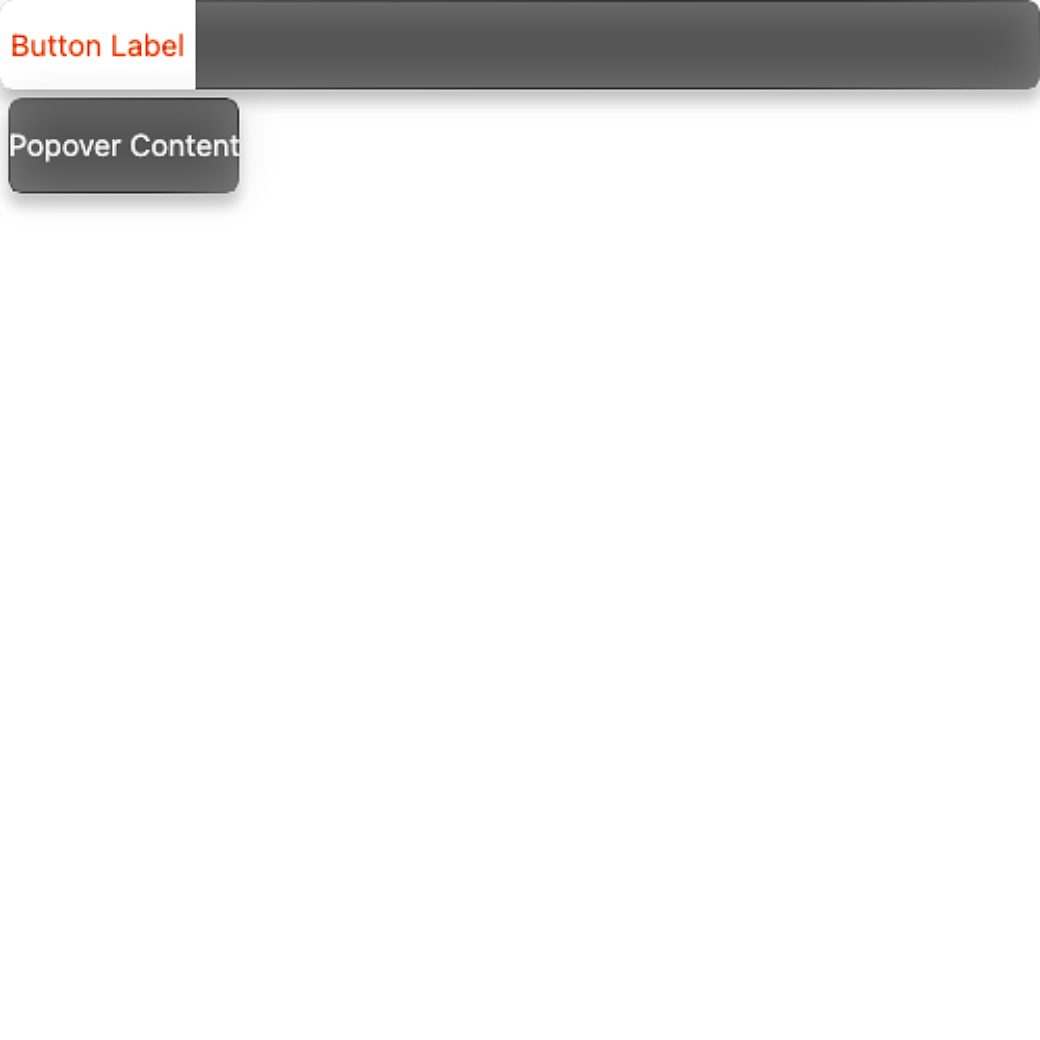
There were a few tests where I wanted to verify that an HTML popover would be visible, but I found that using .toBeVisible() didn’t work reliably. In order to take a screenshot I would adjust the size of the viewport to make sure there was room for the <admin-bar> element and the popover.
test('Button click opens popover', async () => {
  await page.viewport(500, 500)

  const screen = render(
    html`<admin-bar>
      <admin-bar-button>
        Button Label
        <p slot="popover">Popover Content</p>
      </admin-bar-button>
    </admin-bar>`
  )

  await screen.getByText('Button Label').click()

  if (import.meta.env.ENABLE_SCREENSHOTS) {
    await expect(screen.baseElement).toMatchScreenshot('admin-bar-button-popover')
  }
})
I think this gets into the unpredictable territory that the Vitest docs worry about, but I have found that this hasn’t caused any errors so far. Here is what it looks like for that test:
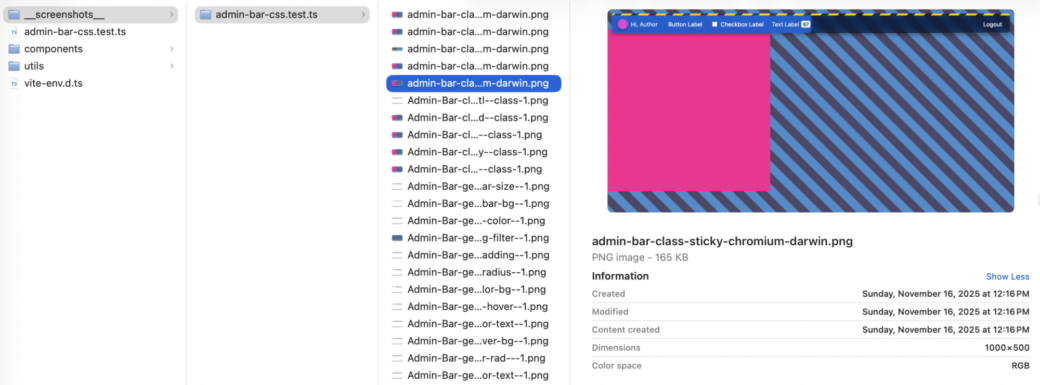
Testing Each CSS Custom Property
One of the things I was looking forward to with Vitest’s visual regression testing feature is to run through the full list of CSS custom properties that are available to developers who may want to modify the defaults and customize the look of Admin Bar and it’s child components. To do this, I used test.each() to loop through an array of test data, which resulted in each test taking a screenshot to show the modified CSS values.
describe('Admin Bar general styles', () => {
  beforeEach(async () => {
    await page.viewport(1000, 500)
  })

  test.each([
    {
      name: '--admin-bar-avatar-size',
      css: `admin-bar { --admin-bar-avatar-size: 50px; }`,
      options: [],
    },
    {
      name: '--admin-bar-bg',
      css: `admin-bar { --admin-bar-bg: linear-gradient(to bottom, rebeccapurple, aliceblue); }`,
      options: [],
    },
    {
      name: '--admin-bar-bg-color',
      css: `admin-bar { --admin-bar-bg-color: rebeccapurple; }`,
      options: [],
    },
    // ... etc ...
  ])('$name', async ({ name, css, options }) => {
    let progressValue = ''
    if (options.includes('show-progress')) {
      progressValue = '50'
    } else if (options.includes('show-progress-error')) {
      progressValue = '-1'
    } else if (options.includes('show-progress-success')) {
      progressValue = '100'
    }

    const screen = render(html`
      <admin-bar
        class="sticky"
        show-environment
        show-greeting
        show-logout
        avatar-alt="avatar"
        avatar-src="${fpoImageSrc}"
        greeting-text="Hi, Author"
        logout-label="Logout"
        logout-url="#"
        progress="${progressValue !== '' ? progressValue : nothing}"
      >
        <admin-bar-button>
          Button Label
          <p slot="popover">Popover Content</p>
        </admin-bar-button>
        <admin-bar-checkbox>Checkbox Label</admin-bar-checkbox>
        <admin-bar-text label-content="67">Text Label</admin-bar-text>
      </admin-bar>
      <style>
        ${css} admin-bar {
          --admin-bar-transition-duration: 0s;
        }
        *,
        *::before,
        *::after {
          animation-duration: 0s !important;
          animation-delay: 0s !important;
          transition-duration: 0s !important;
          transition-delay: 0s !important;
        }
      </style>
      <div style="position: fixed; inset-block-end: 0; width: 20px; aspect-ratio: 1;" data-testid="reset-button"></div>
    `)

    if (options.includes('click-popover')) {
      await userEvent.click(screen.getByText('Button Label'))
    }
    if (options.includes('hover-button')) {
      await userEvent.hover(screen.getByText('Button Label'))
    } else if (options.includes('hover-logout')) {
      await userEvent.hover(screen.getByText('Logout'))
    }

    if (import.meta.env.ENABLE_SCREENSHOTS) {
      await expect(screen.baseElement).toMatchScreenshot(`css-variable${name}`)
    }

    await userEvent.click(screen.getByTestId('reset-button'))
    await userEvent.hover(screen.getByTestId('reset-button'))
  })
})
For each item in the array, the <admin-bar> element gets mounted, the CSS is swapped out, then I made it so you can pass in a few options to test user events or to modify prop values.
One thing I’ll note is that this seemed to slow down my testing by a bit. Each test took about 200ms, and after 30+ tests it adds a few seconds to the overall test run. Still, this is exactly what got me excited about doing local visual regression testing, as these tests would be much harder to verify with unit tests or component tests.
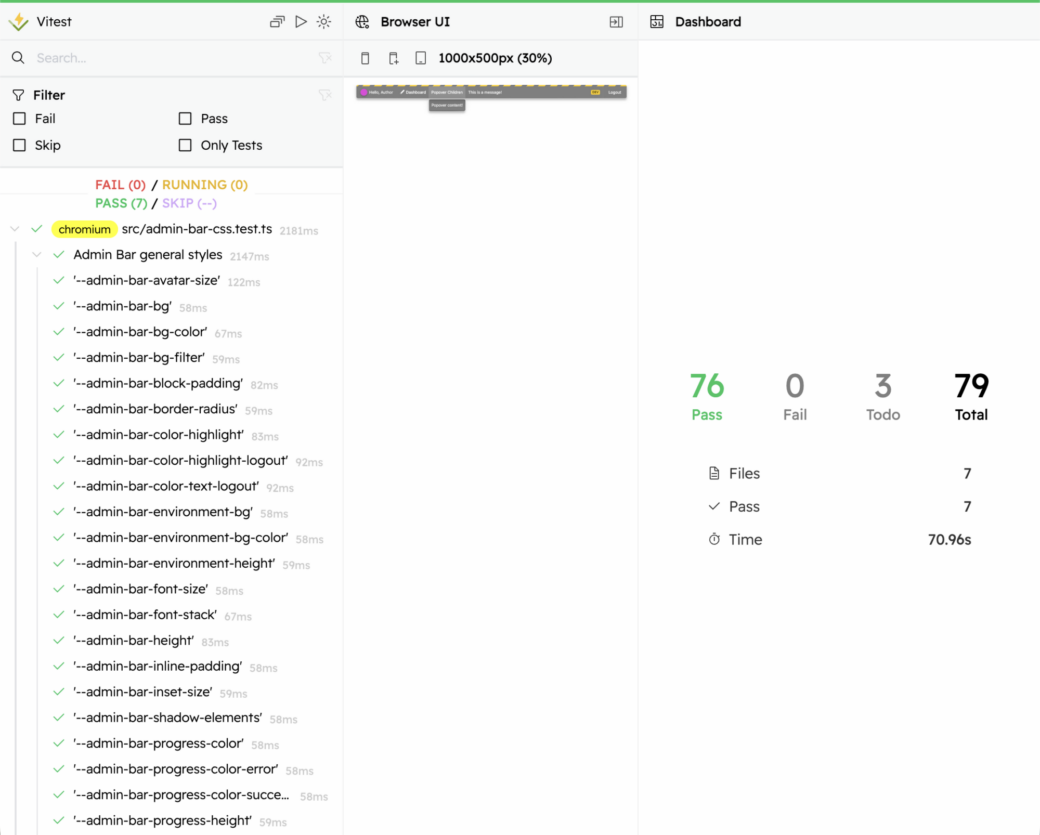
In the current version of Vitest, the time seems to be calculated wrong. These tests took less than 10 seconds in total.
Fin
I just finished setting all of this up so I’m still too early on to find all the warts, but for now I think Vitest has added some really exciting features in 4.0. As it goes with open source work, there are a few bugs and I find myself terminating my test watch and re-running tests pretty often. The Vitest team has a backlog of issues on their GitHub repo and I can see them working through them quickly. I only think it’ll get better as time goes on.
Before going all-in on Vitest, there are still a lot of things to consider. I think where Vitest is good for one simple set of components, I wonder how well it would do with a bigger app. I didn’t get into E2E tests, mocking API requests, routing, or even most of the new browser assertions. I’m also running all of this locally, so I didn’t get into how you might need to set up a server to store testing screenshots to verify across multiple contributors. In my experience Cypress and the full Playwright suite are much more capable and full-featured, so it may be a little bit before Vitest becomes people’s go-to component testing suite, but there's a lot of potential.